The Real Cost of Living in Phoenix, AZ: A Complete 2026 Breakdown
February 7, 2024
February 7, 2024
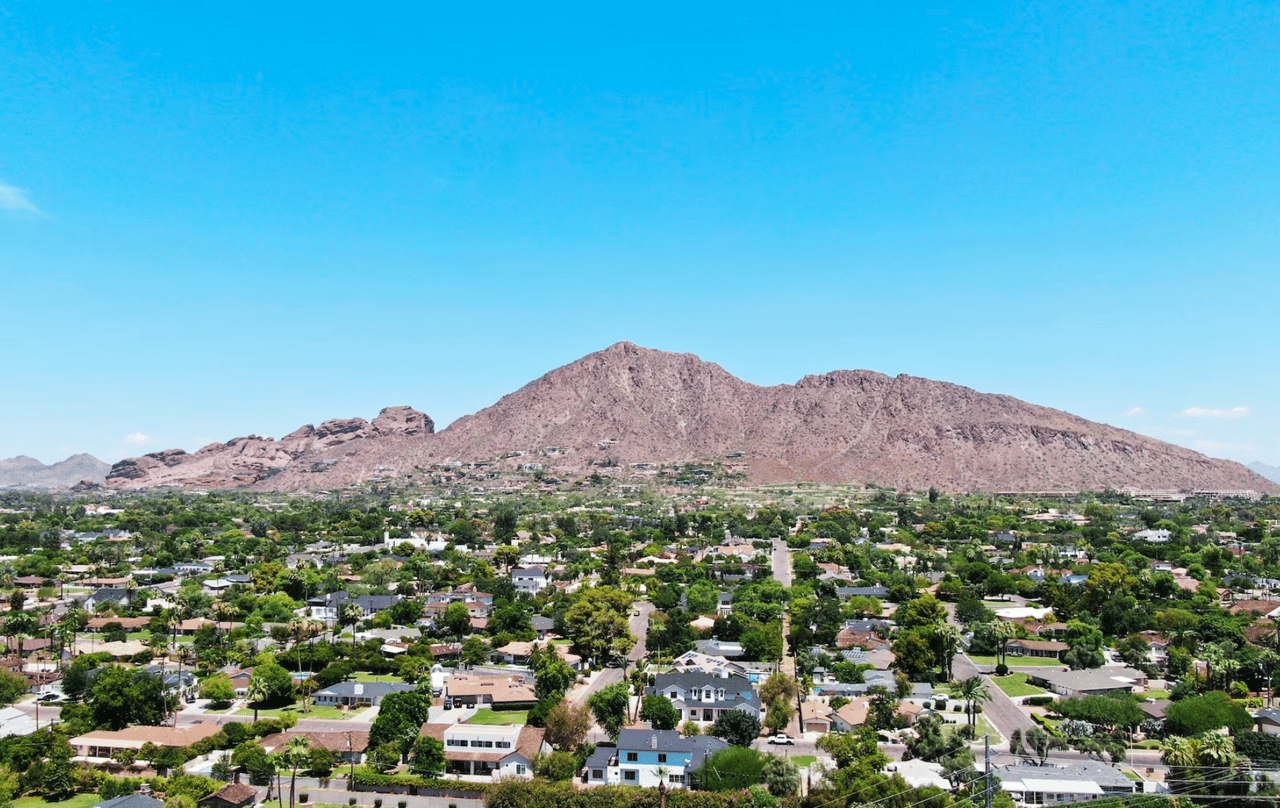
Phoenix, Arizona is no longer the budget desert escape it once was. Over the last five years, the Valley of the Sun has transformed into a legitimate economic powerhouse — attracting semiconductor manufacturers, tech firms, and tens of thousands of relocating residents annually. With that growth has come a meaningful rise in the cost of living.
But the full picture is more nuanced than the headlines suggest. Phoenix still offers genuine financial advantages over coastal metros, a tax structure that rewards homeowners, and a lifestyle that's hard to replicate at any price point. This guide breaks down every major cost category with real 2026 numbers, so you can make an informed decision about whether Phoenix makes sense for your budget.
Phoenix currently ranks approximately 26th nationally for highest cost of living — placing it in the "moderately high" tier, a significant shift from its historical reputation as a cheap desert alternative.
Overall, the city sits roughly 6.5% to 9% above the U.S. national average. Housing is the primary driver, running about 15.6% above the national norm. Utilities come in around 7.4% above average, largely due to extreme summer cooling demands. Transportation runs about 5.3% above average given the city's car-dependent layout. The one consistent bright spot: healthcare, which comes in approximately 5% below the national average.
For coastal transplants, Phoenix still represents significant savings. It remains roughly 73% cheaper than San Francisco and about 60% cheaper than New York City. For residents moving from the Midwest or Sun Belt interior, however, the "Phoenix discount" has largely evaporated.
What keeps people coming? Despite the rising costs, Phoenix added 59,065 residents in 2025 alone, bringing the metro area's total population to approximately 5.23 million. At a growth rate of 1.14%, Phoenix is expanding more than twice as fast as the national average of 0.52%. Three forces drive that growth: a booming "Silicon Desert" economy anchored by TSMC and Intel's semiconductor investments, relative affordability for equity migrants from California and the Pacific Northwest, and a master-planned community lifestyle that continues to attract families and remote workers.
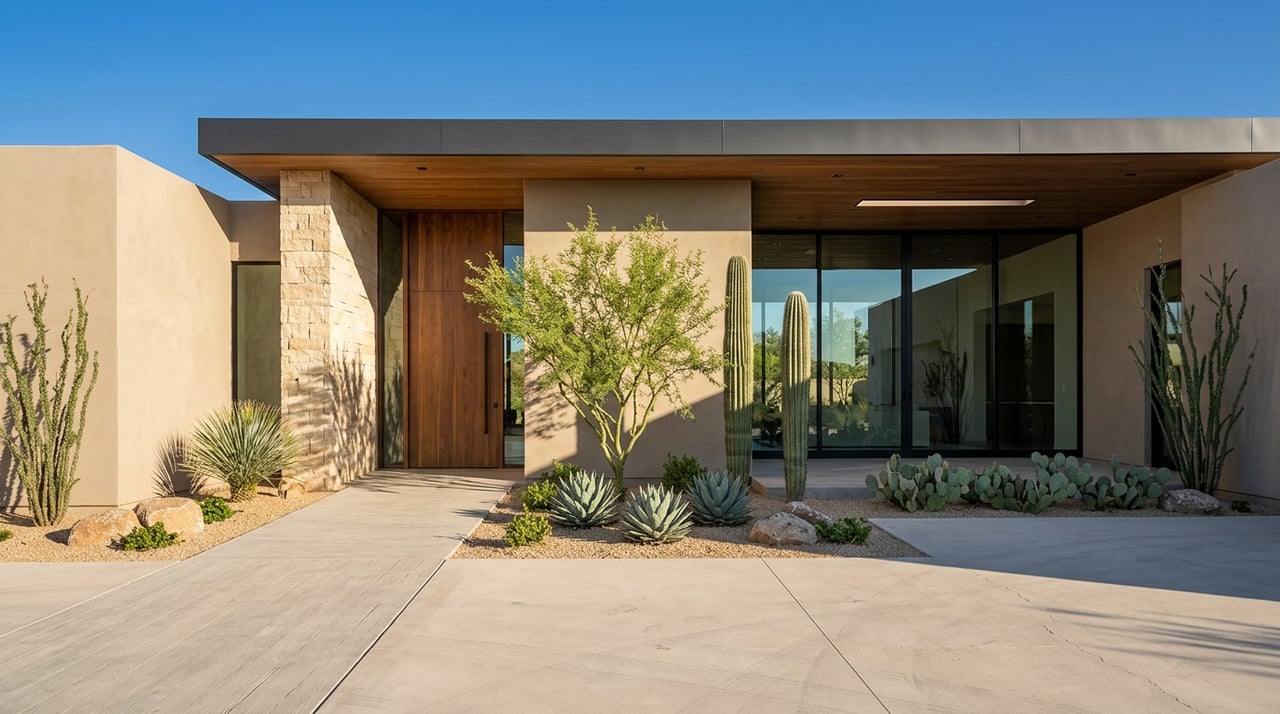
Phoenix's housing market in 2026 is in what analysts are calling a "cooling correction." After the explosive appreciation of 2020–2023, rising inventory and elevated interest rates have pulled prices back slightly. The current median home price sits at approximately $458,000–$460,000, down about 5.2% from 2025.
That correction has created a more balanced environment for buyers. Roughly 35%–45% of listings see at least one price reduction before selling, and the vacancy rate in the rental market has climbed to 8.4%, pushing landlords to offer concessions.
Average rents by unit type in Phoenix as of 2026:
Location drives significant variation. Downtown Phoenix averages around $2,450/month, while neighborhoods like Maryvale and Alhambra remain closer to $1,200/month. Rents are currently trending down about 4% year-over-year — a direct result of the wave of new apartment completions in 2024 and 2025 flooding the market with supply.
Phoenix has lost its title as the budget Sun Belt destination. It now sits in the middle of the regional pack:
| City | Median Home Price | vs. Phoenix |
|---|---|---|
| Denver | $585,000 | ~27% more expensive |
| Austin | $530,000 | ~15% more expensive |
| Phoenix | $460,000 | — |
| Dallas | $445,000 | ~3% cheaper |
| Las Vegas | $439,000 | ~5% cheaper |
The average Phoenix resident spends approximately 32.4% of gross income on housing — just above the 30% threshold that defines "cost-burdened." Local wages, while growing in the tech sector, have not fully kept pace with the 40%+ home price appreciation seen between 2020 and 2023.
Phoenix utilities are a tale of two seasons. While the per-unit rates are actually lower than the national average, the sheer volume of energy required to survive a desert summer produces some of the most dramatic seasonal bill swings in the country.
| Utility | Average Monthly Bill | vs. National Avg |
|---|---|---|
| Electricity | $211–$235 | Rate is ~24% lower |
| Water/Sewer | $45–$65 | ~35% lower |
| Natural Gas | $40–$60 | ~15% lower |
The "average" monthly bill is misleading in Phoenix. Most residents experience a 300%–500% increase in their electricity costs between February and July.
Arizona's electricity rate is approximately $0.15 per kWh — significantly cheaper than the national average of $0.20 per kWh. The problem is volume: Phoenix households use roughly 1,400–2,000+ kWh per month in summer, compared to 600–800 kWh for a household in a temperate climate.
One important caveat for SRP customers: many Phoenix plans include a "Demand Charge," meaning running your dryer, dishwasher, and A/C simultaneously during on-peak hours (typically 4–7 PM) can trigger a surcharge even if your total monthly usage is modest. Both APS and SRP offer "Budget Billing" — a program that averages your annual usage into 12 equal monthly payments — which is worth enrolling in to avoid the summer spike.
Water bills follow a similar seasonal pattern: $35–$45/month in winter, climbing to $80–$110/month in summer, particularly for homes with pools or grass lawns. Desert-landscaped (xeriscape) properties see a much smaller seasonal increase and are worth prioritizing if water costs are a concern.
Food costs are one of Phoenix's relative bright spots. The city's grocery index sits at 102.8 — just 2.8% above the national average — and local food inflation (approximately 3.0% as of May 2026) is running below the national average of 3.8%, meaning prices are stabilizing faster here than in most major metros.
Shoppers at Fry's (Kroger) and Sprouts generally pay prices close to the national average. High-end options like AJ's Fine Foods can push a family budget above $1,800/month.
Phoenix's proximity to Yuma — the "Winter Salad Bowl" of the U.S. — and the Mexican border keeps fresh produce prices lower and quality higher than in the Midwest or Northeast. The Valley's high grocery store density (Fry's, Bashas', Safeway, Walmart, and ALDI all compete aggressively) also suppresses prices compared to cities with less retail competition.
The one notable exception: coffee and imported pantry goods, where Phoenix runs 10%–14% above the national average.
Phoenix was built for the automobile, and that reality shapes the monthly budget of nearly every resident.
Valley Metro operates a bus network and a single 28-mile light rail line. The monthly pass costs $64, with a smart "capping" system — once you spend $64 in a calendar month, the rest of your rides are free.
The limitation is coverage. The light rail is effective for the Mesa–Tempe–Downtown Phoenix corridor but doesn't reach the major population hubs in the North or West Valley. Bus headways outside main corridors can exceed 30 minutes — a significant deterrent when it's 110°F outside. Unless you live and work along the light rail corridor, owning a car is effectively a quality-of-life requirement.
The I-10 "Broadway Curve" remains one of the most congested interchanges in the nation. Phoenix traffic is directional: morning flow heads toward Downtown and the Price Corridor in Chandler; evenings reverse.
| Category | Monthly Estimate |
|---|---|
| Gas | $160–$210 |
| Insurance | $236 |
| Downtown parking | $80–$150 |
| Total (car owner) | $476–$596+ |
Healthcare is consistently one of Phoenix's most competitive cost categories.
Phoenix's healthcare index sits at 95.9 — meaning it's about 4.1% cheaper than the national average.
Phoenix is a major regional healthcare hub with exceptional depth of infrastructure. Mayo Clinic — one of only three major locations globally — is consistently ranked the top hospital in Arizona. Banner Health, the largest employer in the state, operates Banner University Medical Center as the primary teaching hospital for the UA College of Medicine. HonorHealth dominates the North Phoenix and Scottsdale regions. The city is also home to Barrow Neurological Institute at St. Joseph's, globally recognized for neurosurgery and research. In the suburbs — Gilbert, Chandler, North Scottsdale — emergency and urgent care centers are available on nearly every major corner.
Arizona's tax landscape has undergone a major transformation in recent years, and it now ranks as one of the most competitive tax environments among states that still collect income tax.
As of the 2025 and 2026 tax years, Arizona operates on a fully implemented flat tax of 2.5% for all filers regardless of income. This is one of the lowest flat rates in the nation — down significantly from the previous top bracket of 4.5%.
Phoenix's combined sales tax rate is 8.6%, broken down as follows: 5.6% state, 0.7% Maricopa County, and 2.3% city of Phoenix. Arizona does not tax groceries for home consumption at the state level, though Phoenix still applies its local portion to grocery purchases.
This is where Arizona delivers its clearest financial advantage. The effective property tax rate in Maricopa County is approximately 0.51% — nearly 50% below the national average of 0.99%. By law, the "Limited Property Value" — the assessed value used for tax purposes — cannot increase by more than 5% per year, even if your home's market value jumps 20%.
| State | Income Tax | Property Tax | Avg Sales Tax |
|---|---|---|---|
| California | 1%–13.3% | ~0.71% | 8.85% |
| Arizona | 2.5% flat | ~0.51% | 8.60% |
| Nevada | 0% | ~0.48% | 8.23% |
| Texas | 0% | ~1.60% | 8.20% |
The comparison with Texas is particularly instructive. While Texas has no income tax, its property taxes are roughly triple Arizona's. On a $500,000 home, the lower Arizona property tax often offsets the 2.5% income tax, making the total annual tax burden surprisingly similar between the two states. For high earners relocating from California, the savings are dramatic — moving from California's top bracket to Arizona's flat rate can save roughly 10.8% of gross income in state taxes alone.
Childcare in the Valley is expensive and heavily in demand.
For top-tier centers in suburbs like Gilbert or North Scottsdale, expect a 6–12 month waitlist. Many families secure their spot as soon as a pregnancy is confirmed.
Arizona uses an A–F letter grade system for public schools. Scottsdale Unified, Chandler Unified, and Gilbert Public Schools consistently earn the highest ratings. The state is also a national leader in charter school quality — networks like BASIS and Great Hearts Academies are tuition-free public schools that regularly appear in U.S. News & World Report's top 10 high school rankings nationally.
Arizona's Empowerment Scholarship Account (ESA) program is now universal — every K–12 student in the state is eligible. The program provides approximately $7,000–$8,000 per student per year in state funds that can be applied toward private school tuition, homeschool curricula, tutoring, or educational technology. For a family paying $15,000/year in private school tuition, the ESA effectively reduces the out-of-pocket cost to around $8,000. Students with an IEP or 504 plan can receive significantly more — up to $32,000 per year — to cover specialized therapies and private tuition.
Phoenix has one of the most competitive gym markets in the country due to heavy market saturation, which keeps prices low:
Golf is a defining Phoenix lifestyle expense, and the price variance between seasons is dramatic:
Phoenix's municipal park system is the largest in the world, and it's entirely free. Camelback Mountain, Piestewa Peak, and South Mountain Park & Preserve require no permits and no entry fees. For approximately $45 per year, the Phoenix Card provides discounts on city-run golf courses and priority booking at municipal facilities. Phoenix Public Libraries offer a Culture Pass program that provides two free tickets to major attractions like the Desert Botanical Garden and the Heard Museum. Nearly every major suburb also maintains free, massive splash pad facilities — essential summer entertainment for families.
| Metric | Phoenix | Scottsdale | Austin | Denver | Las Vegas | Nat'l Avg |
|---|---|---|---|---|---|---|
| COL Index | 110.7 | 134.2 | 112.5 | 114.8 | 104.5 | 100.0 |
| Median Home | $460K | $815K | $530K | $585K | $439K | $422K |
| Avg Utility | $231/mo | $265/mo | $185/mo | $160/mo | $215/mo | $195/mo |
| Grocery Index | 102.8 | 108.5 | 101.4 | 99.5 | 104.2 | 100.0 |
| State Income Tax | 2.5% | 2.5% | 0% | 4.4% | 0% | Varies |
| Property Tax | ~0.5% | ~0.5% | ~1.8% | ~0.5% | ~0.5% | ~1.0% |
In 2026, Phoenix is most comparable to Austin, Texas. Both cities have transitioned from affordable alternatives to premium tech hubs. They share nearly identical grocery costs, cooling rental markets, and heavy dependence on high-wage employment in semiconductor and software sectors. Phoenix retains a slight edge in housing affordability and utility rates; Austin wins on public infrastructure investment.
Las Vegas remains the only major Southwestern city consistently cheaper than Phoenix overall, with a COL index of 104.5 and no state income tax. Living just 20 minutes north in Scottsdale carries a roughly 21% cost premium over Phoenix — almost entirely driven by housing scarcity and the concentration of luxury services.
Single person: $3,650–$4,200/month
Family of four: $8,200–$9,400/month
At the current median price of approximately $481,500 and a 6.4% mortgage rate with 10% down, the estimated total monthly payment (PITI) runs $3,150–$3,350. To keep housing at or below 30% of gross income, a household needs to earn roughly $115,000–$130,000 annually.
| Household | Required Annual Income | Hourly Wage |
|---|---|---|
| 1 adult, no kids | $53,057 | $25.51/hr |
| 2 working adults, 2 kids | $122,765 | $29.51/hr each |
| 1 adult, 2 kids | $115,894 | $55.72/hr |
| Benchmark | Annual Income | Monthly Net (Est.) |
|---|---|---|
| Basic survival (living wage) | $53,057 | ~$3,700 |
| Comfortable single living | $72,000+ | ~$5,000 |
| Homeownership entry (median) | $126,000+ | ~$8,400 |
| Comfortable family living | $145,000+ | ~$9,800 |
Understanding the cost of living is one thing — finding the right home within your budget in the right neighborhood is another. The Craig Bennett Group specializes in helping buyers navigate the Phoenix and Scottsdale real estate markets with the kind of local depth that only comes from generations in the business.
Craig Bennett is an Arizona-native Associate Broker at Russ Lyon Sotheby's International Realty, with expertise spanning first-time buyers, investors, and out-of-state relocations. Whether you're trying to determine which Phoenix neighborhood fits your budget or you're ready to start touring homes, Craig and his team provide personalized guidance from the first conversation through closing day.
Craig Bennett Group 6900 E Camelback Road, Suite 110, Scottsdale, AZ 85251 📞 602.908.5279 ✉️ [email protected]

Primary phone
602.908.5279License Number
#BR024633000Address
6900 E Camelback Road Suite 110,About the Author
May 14, 2026

May 4, 2026
A Complete Guide to Investing in Paradise Valley, AZ Real Estate.
May 4, 2026
How to Know When You've Found the Right Home in Scottsdale, AZ.
Craig Bennett Group goes above and beyond to understand your needs and exceed your expectations. Navigate the Metro Phoenix real estate market with expertise, providing personalized guidance and a seamless experience from start to finish.